
Page 30 - FULL YEAR BOOK 2021
P. 30
Iraq
Rice Production, Supply, and Demand Statistics
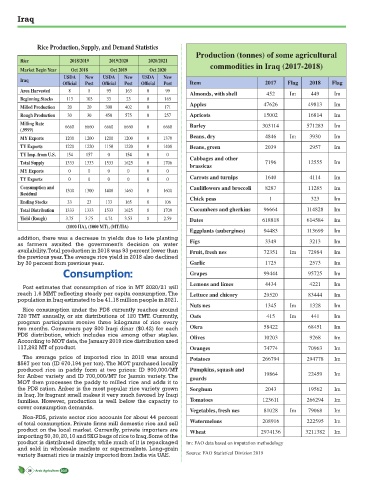
Production (tonnes) of some agricultural
Rice 2018/2019 2019/2020 2020/2021
commodities in Iraq (2017-2018)
Market Begin Year Oct 2018 Oct 2019 Oct 2020
USDA New USDA New USDA New
Iraq
Official Post Official Post Official Post Item 2017 Flag 2018 Flag
Area Harvested 8 8 95 163 0 99
Almonds, with shell 452 Im 449 Im
Beginning Stocks 113 103 33 23 0 165
Apples 47626 49813 Im
Milled Production 20 20 300 402 0 171
Rough Production 30 30 450 575 0 257 Apricots 15002 16814 Im
Milling Rate 6660 6660 6660 6660 0 6660 Barley 303114 571283 Im
(.9999)
MY Exports 1200 1200 1200 1200 0 1370 Beans, dry 4846 Im 3930 Im
TY Exports 1220 1220 1150 1220 0 1400 Beans, green 2039 2957 Im
TY Imp. from U.S. 154 157 0 154 0 0
Cabbages and other
Total Supply 1333 1333 1533 1625 0 1706 7196 12555 Im
brassicas
MY Exports 0 0 0 0 0 0
Carrots and turnips 1640 4114 Im
TY Exports 0 0 0 0 0 0
Consumption and 1300 1300 1400 1460 0 1600 Cauliflowers and broccoli 8287 11285 Im
Residual
Chick peas 1 323 Im
Ending Stocks 33 23 133 165 0 106
Total Distribution 1333 1333 1533 1625 0 1709 Cucumbers and gherkins 96664 114828 Im
Yield (Rough) 3.75 3.75 4.74 3.53 0 2.59 Dates 618818 614584 Im
(1000 HA), (1000 MT), (MT/HA)
Eggplants (aubergines) 94483 113699 Im
addition, there was a decrease in yields due to late planting
as farmers awaited the government’s decision on water Figs 3349 3213 Im
availability. Total production in 2018 was 93 percent lower than Fruit, fresh nes 72351 Im 72984 Im
the previous year. The average rice yield in 2018 also declined
by 30 percent from previous year. Garlic 1725 2573 Im
Consumption: Grapes 99444 95725 Im
Lemons and limes 4434 4221 Im
Post estimates that consumption of rice in MY 2020/21 will
reach 1.6 MMT reflecting steady per capita consumption. The Lettuce and chicory 29520 83444 Im
population in Iraq estimated to be 41.18 million people in 2021.
Nuts nes 1345 Im 1328 Im
Rice consumption under the PDS currently reaches around
720 TMT annually, or six distributions of 120 TMT. Currently, Oats 415 Im 441 Im
program participants receive three kilograms of rice every
two months. Consumers pay 500 Iraqi dinar ($0.42) for each Okra 58422 68451 Im
PDS distribution, which includes rice among other staples. Olives 10203 9268 Im
According to MOT data, the January 2019 rice distribution used
117,262 MT of product. Oranges 74774 70963 Im
The average price of imported rice in 2018 was around Potatoes 266794 294778 Im
$567 per ton (ID 670,194 per ton). The MOT purchased locally
produced rice in paddy form at two prices: ID 900,000/MT Pumpkins, squash and
for Anber variety and ID 700,000/MT for Jasmin variety. The 19864 22459 Im
MOT then processes the paddy to milled rice and adds it to gourds
the PDS ration. Anber is the most popular rice variety grown Sorghum 2043 19562 Im
in Iraq. Its fragrant smell makes it very much favored by Iraqi
families. However, production is well below the capacity to Tomatoes 123611 266294 Im
cover consumption demands.
Vegetables, fresh nes 81028 Im 79068 Im
Non-PDS, private sector rice accounts for about 44 percent
of total consumption. Private firms mill domestic rice and sell Watermelons 208916 222595 Im
product on the local market. Currently, private importers are Wheat 2974136 3211382 Im
importing 50, 30, 20, 10 and 5KG bags of rice to Iraq. Some of the
product is distributed directly, while much of it is repackaged Im: FAO data based on imputation methodology
and sold in wholesale markets or supermarkets. Long-grain
variety Basmati rice is mainly imported from India via UAE. Source: FAO Statistical Division 2019
28 Arab Agriculture 2021
White Section 1-48.indd 28 4/20/21 2:51 PM