
Page 42 - FULL YEAR BOOK 2021
P. 42
Saudi Arabia
SAUDI ARABIA FISHERIES AND AQUACULTURE MARKET - GROWTH,
TRENDS, AND FORECAST (2020 - 2025)
The Saudi Arabia Fisheries and Aqua- per capita, expected to generate an ad-
culture Market is projected to register a ditional demand of 500,000 ton in 2030.
CAGR of 4.1% during the forecast pe- With the government commitment to the
riod (2020-2025). The drivers identified growing industry, introduced the plan
in this market are growing government “Vision 2030” in 2016. The plan focuses
support to the sector, the rapid increase on building safe and strategic food. The
in demand, and the increasing sale of project “Vision 2030” aims to increase
fish via social network platforms. production to 530 thousand ton by 2030.
As a result, there is increased interest
The aquaculture sector in the country
has grown rapidly over the past several from local as well as international inves-
tors for either expanding fish and aqua-
years making the country the top re- culture farming
gional producer and an exporter of sea-
food worldwide. This growth is mainly
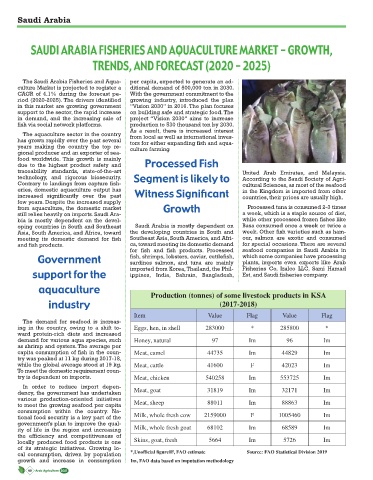
due to the highest product safety and Processed Fish
traceability standards, state-of-the-art United Arab Emirates, and Malaysia.
technology, and rigorous biosecurity. Segment is likely to According to the Saudi Society of Agri-
Contrary to landings from capture fish- cultural Sciences, as most of the seafood
eries, domestic aquaculture output has Witness Significant in the Kingdom is imported from other
increased significantly over the past countries, their prices are usually high.
few years. Despite the increased supply
from aquaculture, the domestic market Growth Processed tuna is consumed 2-3 times
still relies heavily on imports. Saudi Ara- a week, which is a staple source of diet,
bia is mostly dependent on the devel- while other processed frozen fishes like
oping countries in South and Southeast Saudi Arabia is mostly dependent on Basa consumed once a week or twice a
Asia, South America, and Africa, toward the developing countries in South and week. Other fish varieties such as ham-
meeting its domestic demand for fish Southeast Asia, South America, and Afri- our, salmon are exotic and consumed
and fish products. ca, toward meeting its domestic demand for special occasions. There are several
for fish and fish products. Processed seafood companies in Saudi Arabia in
Government fish, shrimps, lobsters, caviar, cuttlefish, which some companies have processing
sardines salmon, and tuna are mainly
plants, imports even exports like Arab
support for the imported from Korea, Thailand, the Phil- Fisheries Co, Izalco LLC, Sami Hamad
Est, and Saudi fisheries company.
ippines, India, Bahrain, Bangladesh,
aquaculture
Production (tonnes) of some livestock products in KSA
industry (2017-2018)
Item Value Flag Value Flag
The demand for seafood is increas-
ing in the country, owing to a shift to- Eggs, hen, in shell 283000 * 285800 *
ward protein-rich diets and increased
demand for various aqua species, such Honey, natural 97 Im 96 Im
as shrimp and oysters. The average per
capita consumption of fish in the coun- Meat, camel 44735 Im 44829 Im
try was peaked at 11 kg during 2017-18,
while the global average stood at 19 kg. Meat, cattle 41600 F 42023 Im
To meet the domestic requirement coun-
try is dependent on imports. Meat, chicken 540258 Im 553725 Im
In order to reduce import depen-
dency, the government has undertaken Meat, goat 31819 Im 32171 Im
various production-oriented initiatives
to meet the growing seafood per capita Meat, sheep 88011 Im 88863 Im
consumption within the country. Na-
tional food security is a key part of the Milk, whole fresh cow 2159000 F 1005460 Im
government’s plan to improve the qual-
ity of life in the region and increasing Milk, whole fresh goat 68102 Im 68589 Im
the efficiency and competitiveness of
locally produced food products is one Skins, goat, fresh 5664 Im 5726 Im
of its strategic initiatives. Growing lo-
cal consumption, driven by population *,Unofficial figure||F, FAO estimate Source: FAO Statistical Division 2019
growth and increase in consumption Im, FAO data based on imputation methodology
40 Arab Agriculture 2021
White Section 1-48.indd 40 4/20/21 2:51 PM