
Page 181 - FULL YEAR BOOK 2021
P. 181
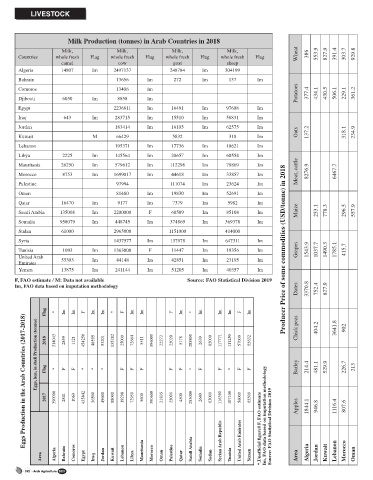
LIVESTOCK


                             Milk Production (tonnes) in Arab Countries in 2018

                           Milk,            Milk,             Milk,            Milk,                     386
             Countries   whole fresh   Flag  whole fresh   Flag  whole fresh   Flag  whole fresh   Flag  Wheat  553.9  827.9  391.4  303.7  929.8
                           camel             cow              goat             sheep
             Algeria      14807     Im     2497137           248784     Im     304199
             Bahrain                        13656     Im      272       Im      137      Im
                                                                                                      Potatoes  377.4  434.1  430.5  506.1  229.1  361.2
             Comoros                        13406     Im
             Djibouti      6050     Im      8858      Im
             Egypt                         2236811    Im      16491     Im     97608     Im
             Iraq          643      Im      283715    Im      15510     Im     58831     Im
             Jordan                         183414    Im      16105     Im     62575     Im
             Kuwait                  M      66429             5832              310      Im           Oats  137.2           318.1  234.9
             Lebanon                        195371    Im      17736     Im     10621     Im
             Libya         2225     Im      145564    Im      20657     Im     60554     Im
                                                                                                      Meat, cattle  8276.9        6467.7
             Mauritania    26250    Im      579612    Im     112298     Im     78869     Im
             Morocco       8753     Im     1699017    Im      44618     Im     33857     Im
             Palestine                      97994            111074     Im     23624     Im
             Oman                           81480     Im      19830     Im     52691     Im
             Qatar         16470    Im       9177     Im      7379      Im      5982     Im
                                                                                                      Maize     253.1  778.3     296.5  557.9
             Saudi Arabia  135008   Im     2200000    F       68589     Im     85108     Im
             Somalia      958079    Im      448745    Im     374869     Im     369378    Im
             Sudan         61000           2965000           1151000           414000
             Syria                         1437577    Im     137978     Im     647311    Im
             Tunisia       1093     Im     1363000    F       11447     Im     18356     Im       Producer Price of some commodities (USD/tonne) in 2018  Grapes  1543.9  1037.7  1490.3  1785.1  415.7
             United Arab
             Emirates      55303    Im      44148     Im      42851     Im     23195     Im
             Yemen         13875    Im      241144    Im      51205     Im     40357     Im
            F, FAO estimate / M: Data not available                                                               Source: FAO Statistical Division 2019
                                                                                                      Dates  3370.8  752.4  827.9
            Im, FAO data based on imputation methodology


                      Flag  *  Im  Im  F  Im  Im  *  F  Im  Im        F  Im  *  Im     Im  Im  F  Im  Chick peas     404.2     3641.8  902
               Eggs Production in the Arab Countries (2017-2018)
                   Eggs, hen, in shell Production (tonnes)  2018  Flag  314043  *  2859  F  1121  F  454250  *  48595  *  53201  *  135282     25000  F  72664  F  5511  F  396000     22272     25020  F  5178  F  285800  *  2639  F  65000     117771  F  111250  *  57000  F  55632  F  Barley  214.4  481.1  529.9     226.7  213


                      2017  390000  2841  1060  435842  36500  49600  88000  19298  72950  5600  390600  21835  25000  4500  283000  2640  63000  116390  107100  56000  65500 *,Unofficial figure|| F, FAO estimate                                                                                                  Im, FAO data based on imputation methodology Source: FAO Statistical Division 2019


                    Area  Algeria  Bahrain  Comoros  Egypt  Iraq  Jordan  Kuwait  Lebanon  Libya  Mauritania  Morocco  Oman  Palestine  Qatar  Saudi Arabia  Somalia  Sudan  Syrian Arab Republic  Tunisia  United Arab Emirates  Yemen  Area  Algeria  Jordan  Kuwait  Lebanon  Morocco  Oman

               392    Arab Agriculture  2021


         Tables 382-392.indd   392                                                                                  4/19/21   2:32 PM