
Page 176 - FULL YEAR BOOK 2021
P. 176
PRODUCTION
flag Im * Im M M Im * Im Im
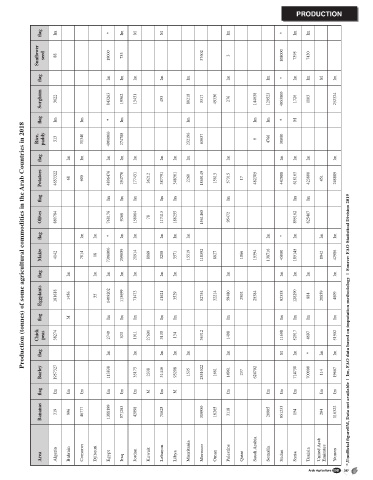
Sunflower seed 88 19000 733 37602 3 108000 7395 7430
flag Im Im Im Im Im Im Im * Im Im M Im
Sorghum 3622 843263 19562 13431 453 80218 3317 49330 276 144038 129523 4953000 1726 1103 252324
flag Im Im * Im Im Im Im * M
Production (tonnes) of some agricultural commodities in the Arab Countries in 2018
Rice, paddy 313 31340 4900000 274788 232196 63037 0 4766 30000
flag Im Im Im Im Im Im Im Im Im Im Im Im Im
Potatoes 4653322 68 600 4896476 294778 177431 36212 387791 348361 2260 1869149 15613 57315 17 482305 442988 618163 423800 451 248889
flag Im Im Im Im Im Im Im Im
Olives 860784 768176 9268 158064 78 117413 188255 1561465 95472 895162 825467
flag Im Im * Im Im Im Im Im Im * Im Im Im
Maize 4142 7014 18 7300000 209059 21914 8869 3288 3571 15519 118392 8827 1866 15394 138716 45000 185145 8942 42986
flag Im Im Im Im Im Im Im Im Im Im Im Im
Eggplants 181618 1456 55 1409202 113699 71473 41621 3529 52754 32214 59480 2902 25384 92558 128290 884 20859 4809
flag M Im Im Im Im Im Im Im Im Im Im
Chick peas 38274 2740 323 1911 27601 3130 134 36312 1498 11698 52917 4697 51902 *,Unofficial figure||M, Data not available | Im, FAO data based on imputation methodology | Source: FAO Statistical Division 2019
flag Im Im Im Im Im Im M Im * Im Im
Barley 1957327 113838 35173 2338 31446 93208 1535 2851022 1661 14961 237 624702 714730 700000 114 19667
flag Im Im Im Im Im Im M Im M Im Im Im Im Im Im
Bananas 319 996 46777 1388199 571283 42098 71625 319950 18265 3118 20905 951233 154 204 116322
Area Algeria Bahrain Comoros Djibouti Egypt Iraq Jordan Kuwait Lebanon Libya Mauritania Morocco Oman Palestine Qatar Saudi Arabia Somalia Sudan Syria Tunisia United Arab Emirates Yemen
Arab Agriculture 2021 387
Tables 382-392.indd 387 4/19/21 2:32 PM